

Airbnb in European Capitals
What the numbers say about short-term rentals across Europe’s capitals
Welcome to Rent Economics: we analyze real-time property data to understand the economics of where we live. Beyond official statistics, we look at asking prices, rental trends, and short-term markets to explore how housing intersects with finance, investment, and public policy.
This week’s lens is on Airbnb across Europe’s capital cities. Our dataset includes 35 capitals, spanning Western, Central, and Eastern Europe — from Lisbon to Istanbul. The selection isn’t strictly political; we’ve taken “Europe” as a cultural-geographic entity, rather than a formal EU delineation.

A note on methodology: For Switzerland, we’ve selected Zurich (instead of the formal capital Bern) and Istanbul (instead of Ankara), more reflective of Airbnb market activity.
Chart 1 - Revenue: Western Europe dominates the STR landscape

When it comes to median annual gross revenue for hosts, the traditional tourism powerhouses lead the way. Paris and Amsterdam top the list, with median host revenues exceeding €42,000, or over €3,500 per month. Reykjavik and Rome follow closely, each also breaking the €3,000/month threshold.
This leadership reflects both consistent tourist demand and market maturity. These cities combine large visitor volumes with relatively high prices and dense Airbnb networks, despite regulatory scrutiny.
Chart 2: Growth hotspots and inflation

Looking at revenue change over the past 12 months (July 2024 to June 2025), Istanbul leads with a striking +29% increase. But this number misleads if taken at face value. It is measured in local currency, the Turkish lira — which has undergone significant depreciation and inflation, distorting real income growth. Turkey's inflation rate is currently 37.90%, as of May 2025, which is lower than the previous month's 38.10% but higher than the long-term average of 28.15%.
The same inflation-adjusted caution applies to other high-growth cities like Tirana, Sarajevo, and Bucharest — all showing double-digit revenue growth, but all operating in high-inflation environments.
By contrast, Rome (-6%), Amsterdam (-2%), and Brussels (-1%) posted real declines. The reasons vary: from saturation (as more listings dilute demand), to seasonal or event-driven shifts, and broader tourism trends influenced by economic headwinds and changing travel patterns.
Chart 3: Daily rates - The tiered structure of Airbnb Europe

Amsterdam, Paris, and Reykjavik lead with average daily rates above €200, forming a premium tier. These are cities with brand strength, limited STR inventory, and strong global tourist pull.
Most major capitals like London, Zurich, Copenhagen, and Berlin sit in the €130–180 range — robust, but slightly below the ultra-premium band.
Further down the chart, Eastern and Southeastern European cities such as Sofia, Tirana, Sarajevo, and Skopje offer average rates below €60, making profitability more dependent on volume and cost efficiency than rate-based margins.
Chart 4: Rate change

Just like revenue, rate change is measured in local currency. Unsurprisingly, Istanbul again leads (+15%), followed by Vienna (+8%), Tirana (+7%), and Stockholm (+6%).
Some of these increases reflect real growth — Vienna and Stockholm have rising demand and stronger pricing — but others, such as Turkey and the Balkans, again may be driven by inflationary pressures rather than host pricing power.
At the bottom of the chart, we find cities with slight declines: Lisbon, Rome, Oslo, and Ljubljana. In Lisbon’s case, this may signal a saturated market adjusting to regulation and affordability concerns.
Chart 5: Occupancy - Lisbon’s crown
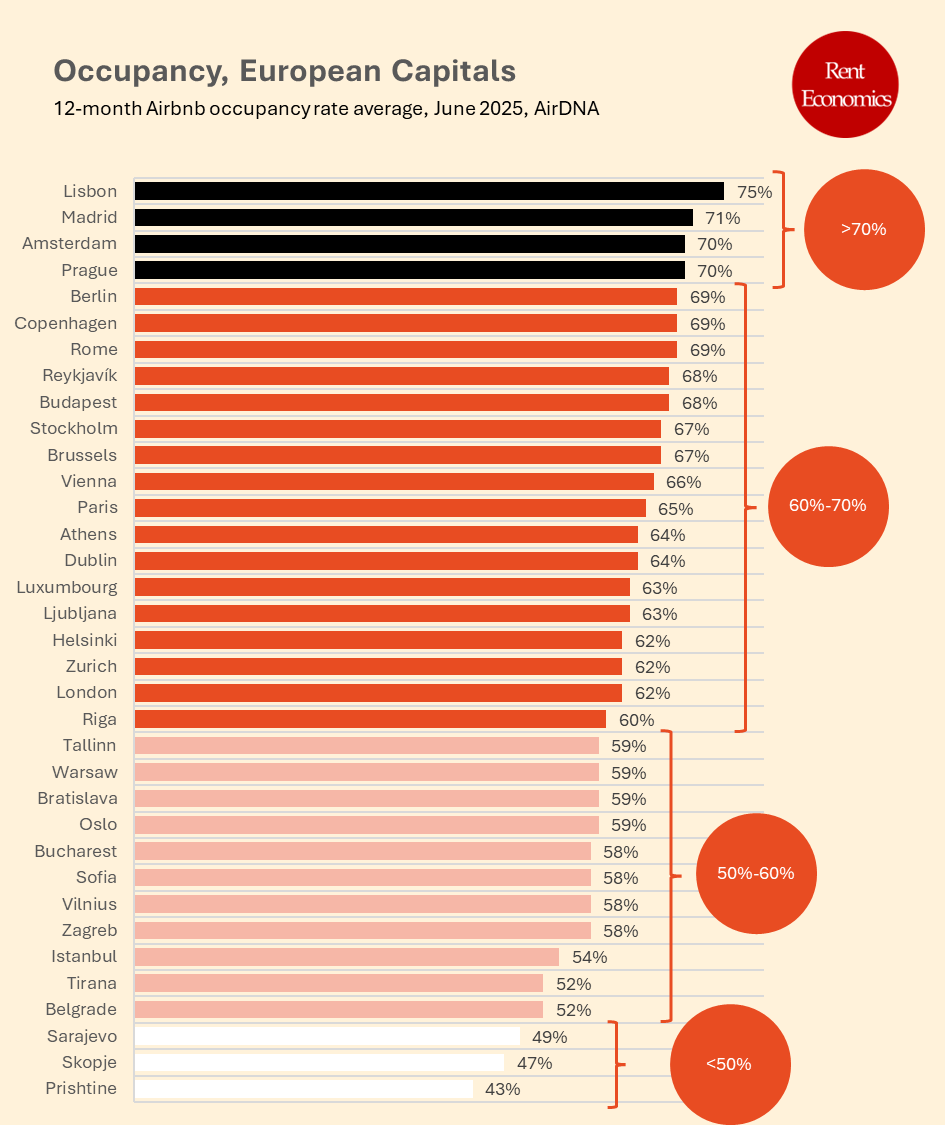
The occupancy rate king is Lisbon, with 75%, a testament to year-round appeal and efficient STR management. Madrid, Amsterdam, Prague, and Berlin follow closely in the 69–71% range.
Occupancy rates below 60% dominate in much of Eastern Europe and the Balkans. Prishtine, Skopje, and Sarajevo fall under 50%, exposing market volatility and uneven tourist demand.
Chart 6: Supply - London, Paris, and Rome lead

London boasts nearly 58,000 active Airbnb listings, followed by Paris (44,000) and Rome (32,000). These are not just high-demand destinations — they are Airbnb metropolises (Note: “Active listings” follow the AirDNA definition, meaning a property must have had at least one bookable night in the past month to be counted).
But high supply isn’t always matched by high profitability. For example, London ranks 5th in revenue, which may reflect pricing pressure, host competition, or regulatory impacts. Oversupply can dampen individual host returns even in high-demand cities.
Chart 7: Rate and Occupancy
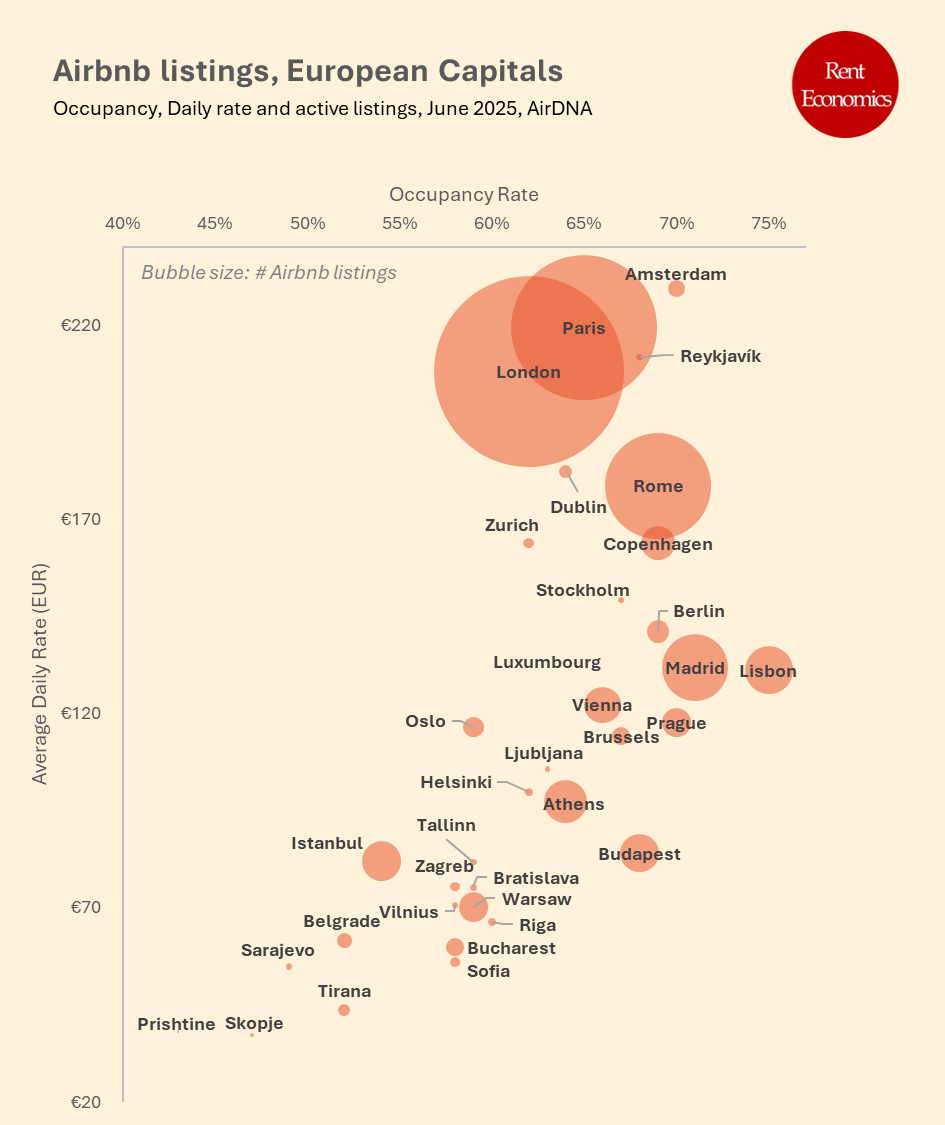
Our final chart maps rate vs. occupancy, with bubble size indicating active listings. The top-right quadrant — high rate, high occupancy — is the Airbnb gold zone, and it includes Amsterdam, Paris, and Reykjavik.
In contrast, cities in the bottom-left corner — like Skopje, Prishtine, and Tirana — suffer from low occupancy and low rates. These cities face structural barriers: fewer international visitors, weaker digital infrastructure, and limited brand visibility.
Final Takeaway
The European Airbnb market is highly stratified. Cities like Paris, Amsterdam, and Reykjavik continue to lead in profitability thanks to pricing power and demand. Others, like Istanbul and Tirana, are showing rapid growth — but much of it is nominal and driven by inflation rather than real demand expansion.
Revenue and rate figures are in local currency, which makes it crucial to evaluate them in context — particularly in countries facing currency volatility and double-digit inflation.
For hosts, investors, and policymakers, the message is clear: market maturity, regulation, inflation, and tourism patterns all shape Airbnb’s urban footprint. A high listing count or rising revenue alone doesn’t tell the full story — what matters is how much of that translates into sustainable, inflation-adjusted returns.
This was all for this edition of the Rent Economics, subscribe for future updates and comment with your feedback.