How UK Airbnb Markets Compare: Edinburgh Leads, Coastal Towns Surge
Inside the UK’s Airbnb Market
June 2025 Airbnb Data Review | Source: AirDNA
The latest AirDNA data for June 2025 provides a revealing cross-section of Airbnb market performance across the United Kingdom. While London remains dominant in scale, smaller cities and holiday destinations are emerging as the most profitable markets for hosts. From high nightly rates in St Ives to exceptionally strong occupancy in Edinburgh, the geography of short-term rental (STR) success is both concentrated and diverse.
Edinburgh Stands Out as the UK’s Top-Earning Market
The first chart ranks UK cities by median annual revenue per host. Edinburgh leads with a median of £44,700, followed by coastal towns like Whitby (£39,800), St Ives (£39,500), and Newquay (£35,300). These markets outperform even large cities like London (£33,000) and Bristol (£32,500).
This ranking reflects not just popularity, but how well each city combines pricing and occupancy to generate host income. Edinburgh’s position is especially notable, given its relatively moderate listing volume compared to London.
Coastal Towns Show Surprising Strength
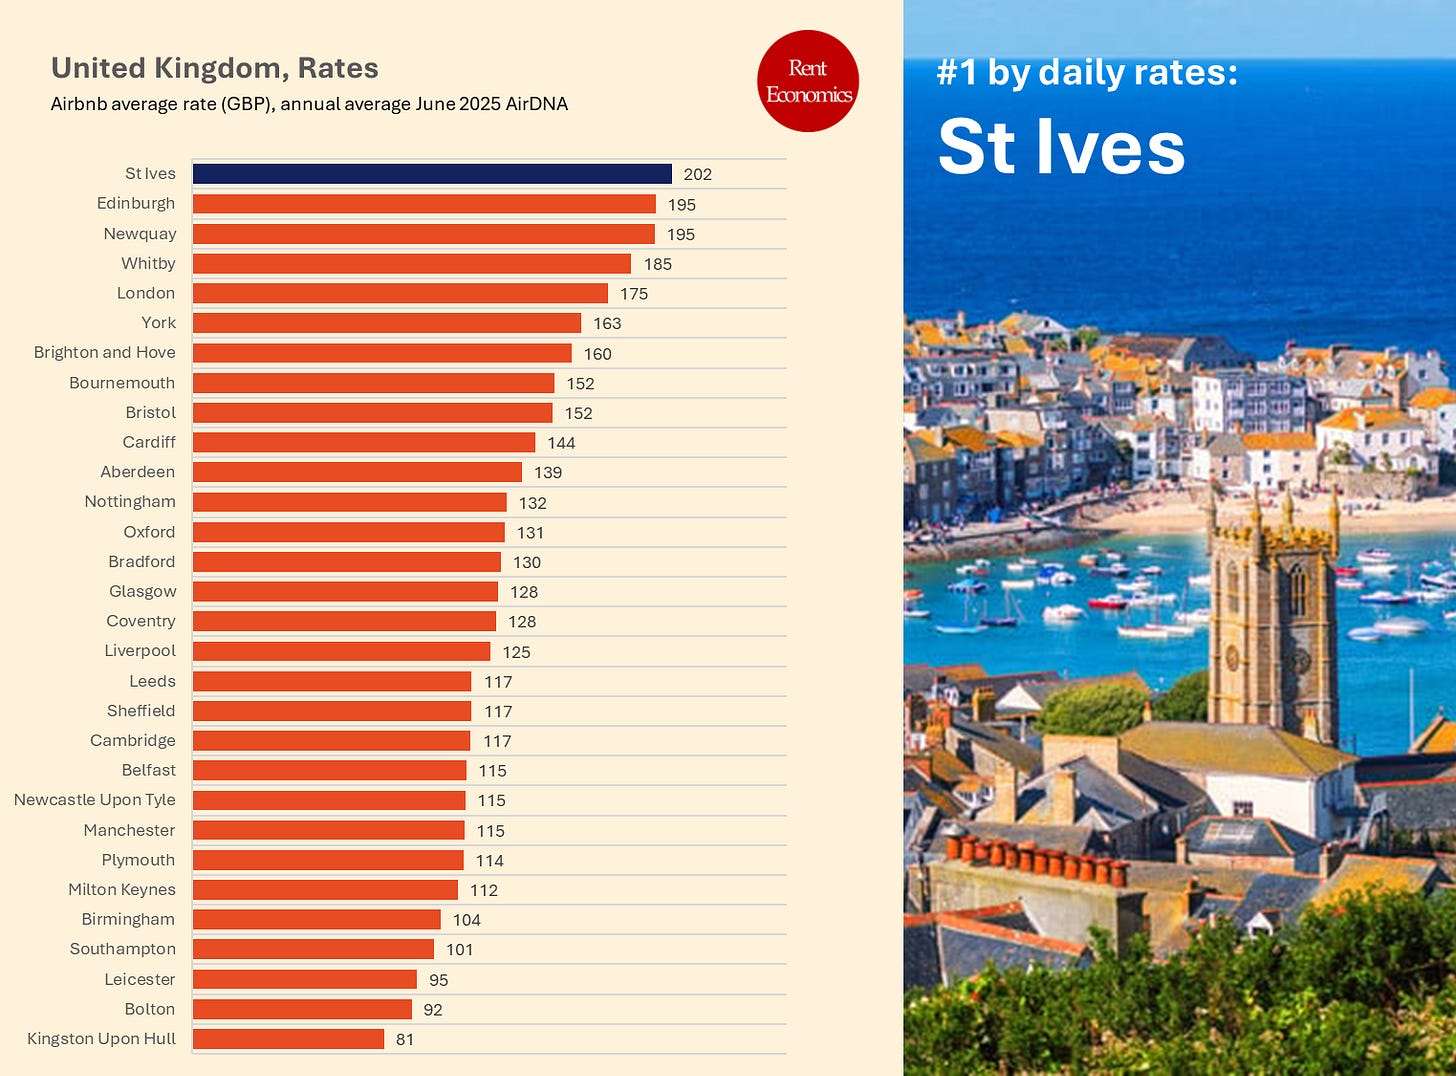
When it comes to nightly pricing, St Ives tops the list with an average rate of £202 per night. It is followed by Edinburgh and Newquay (both at £195) and Whitby (£185).
These elevated rates are typical of seasonal coastal markets, where hosts can charge premium prices during peak periods. However, it’s the combination of high rates and high occupancy that defines a truly high-performing market—something only a few cities manage consistently.
Occupancy Rates – Edinburgh Stands Alone (Again)
Occupancy rates reinforce Edinburgh’s lead: it posts a 73% average occupancy, the highest in the dataset. Other strong performers include York (66%), St Ives (64%), Newquay (63%), and Whitby (64%).
These figures highlight markets with not only tourist appeal but also reliable demand throughout the year, translating to higher revenue stability for hosts.
Total Active Listings – London’s Sheer Volume
According to the definition of AirDNA, an active listing refers to any short-term rental that was available for booking for at least one day in the previous month. This definition captures properties that are actively participating in the market, whether they are full-time vacation rentals or part-time STRs listed seasonally or intermittently. It excludes inactive or delisted properties, ensuring that the data reflects only those listings currently contributing to supply and revenue generation.
Unsurprisingly, London dominates in listing volume, with 57,714 active Airbnb units. The next largest city, Nottingham, has just 7,149—less than 13% of London’s total.
This disparity reflects not only population differences but also the maturity and saturation of London’s STR market. However, London’s high listing count doesn’t equate to higher earnings per host, as seen in the earlier revenue chart.
Listings Per 1,000 Residents – Whitby and St Ives Are Most Saturated
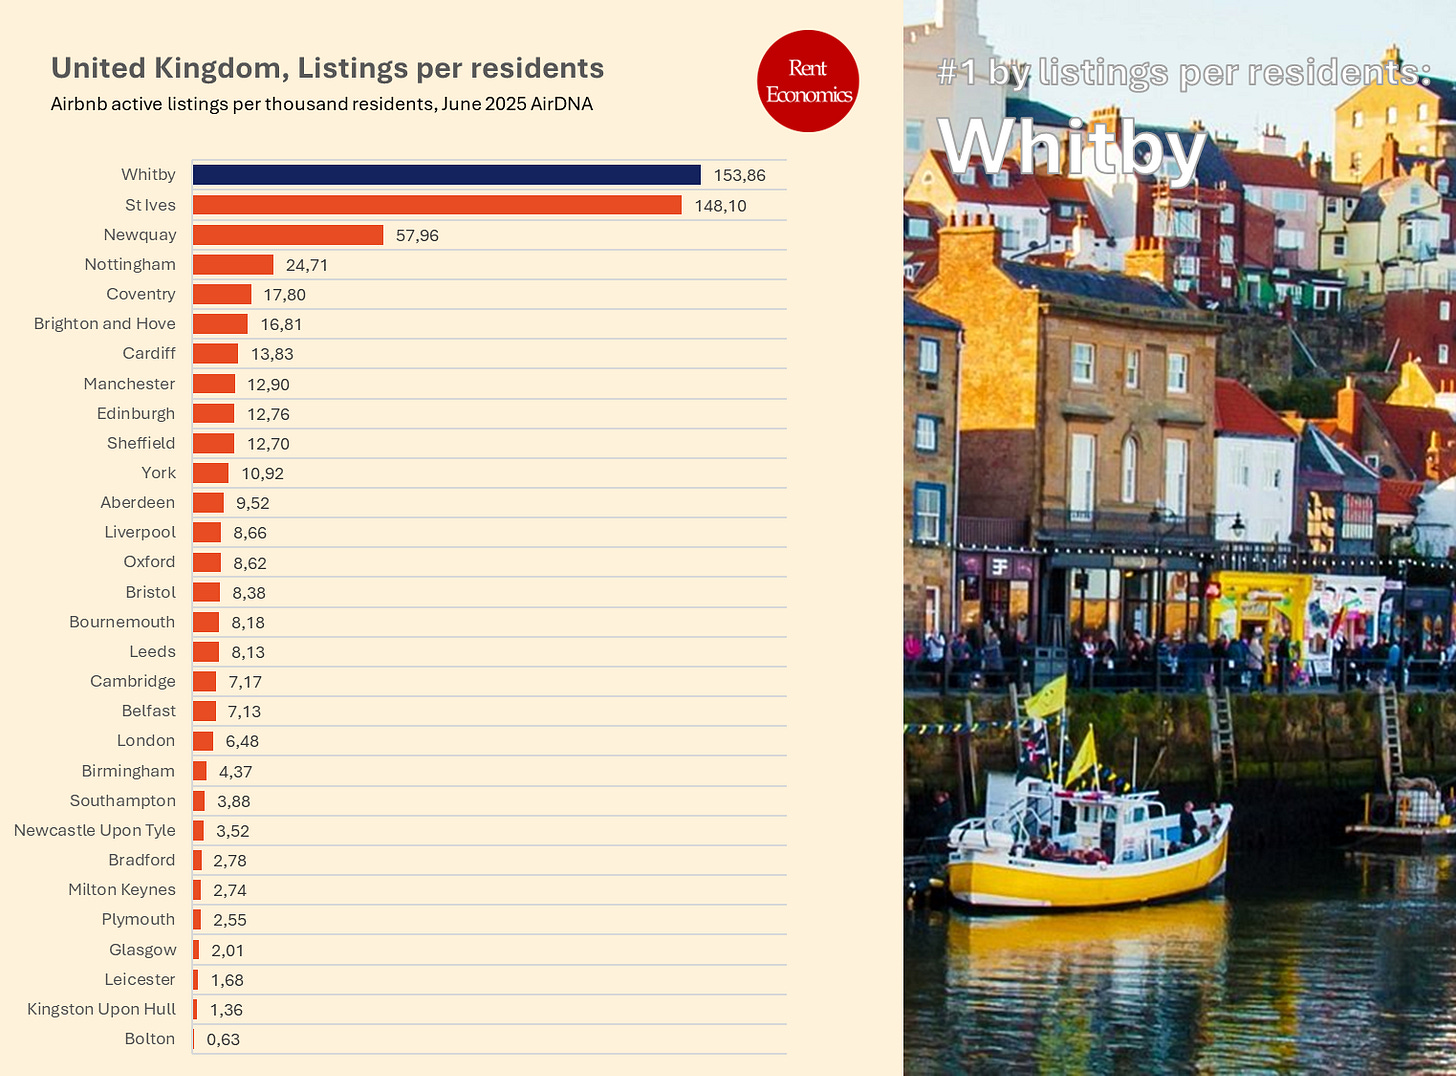
Adjusting for population, Whitby and St Ives emerge as the UK’s most STR-saturated markets, with 154 and 148 listings per 1,000 residents, respectively. Newquay follows with 58 per 1,000.
These ratios reveal how deeply STRs have penetrated housing supply in small towns. In contrast, London's listing density is just 6.5 per 1,000 residents, despite its huge total count.
This metric flags potential pressure points for local housing markets, though this analysis remains focused on the economic side rather than socio-political impacts.
Rates vs. Occupancy – The Sweet Spot Cities
The final chart plots occupancy against daily rates, highlighting cities that succeed on both fronts. Only a few sit in the top-right quadrant, indicating high pricing and high demand:
Edinburgh
St Ives
Whitby
Newquay
These markets represent the most efficient Airbnb ecosystems in the UK. Hosts here are able to maximize both income streams, often in highly seasonal or tourism-dependent economies.
Final Thoughts
This data reveals a fragmented Airbnb landscape, where profitability is not always correlated with size or listing count. Edinburgh remains the gold standard for STR economics in the UK, while small coastal towns continue to punch far above their weight. Meanwhile, many mid-sized cities face lower rates, weaker occupancy, and limited returns.
Thanks for reading Rent Economics. Subscribe and join the conversation.


One of the reasons that Edinburgh is so high in many charts is because due to Scottish Government licensing and Edinburgh councils planning permission rules many STLs have shut down. Right now only 2200 whole property lets have a licence and about 3000 room in a shared property. The number of whole properties available will start to go down even further as final planning permission applications start to get turned down. Edinburgh council is currently pretty much not approving any STL planning permission. In the meantime hotel prices have gone through the roof.